
Top 5 Ways to Understand Candlestick Charts Without Getting Overwhelmed
Position holding is one of the most misunderstood parts of using candlestick charts effectively. Too often, beginners look at them like magic tricks—see a certain shape, and boom, it must mean “buy” or “sell,” right? Not quite. Let’s walk through five simple ways to truly get what these candles are telling you—without overcomplicating things.
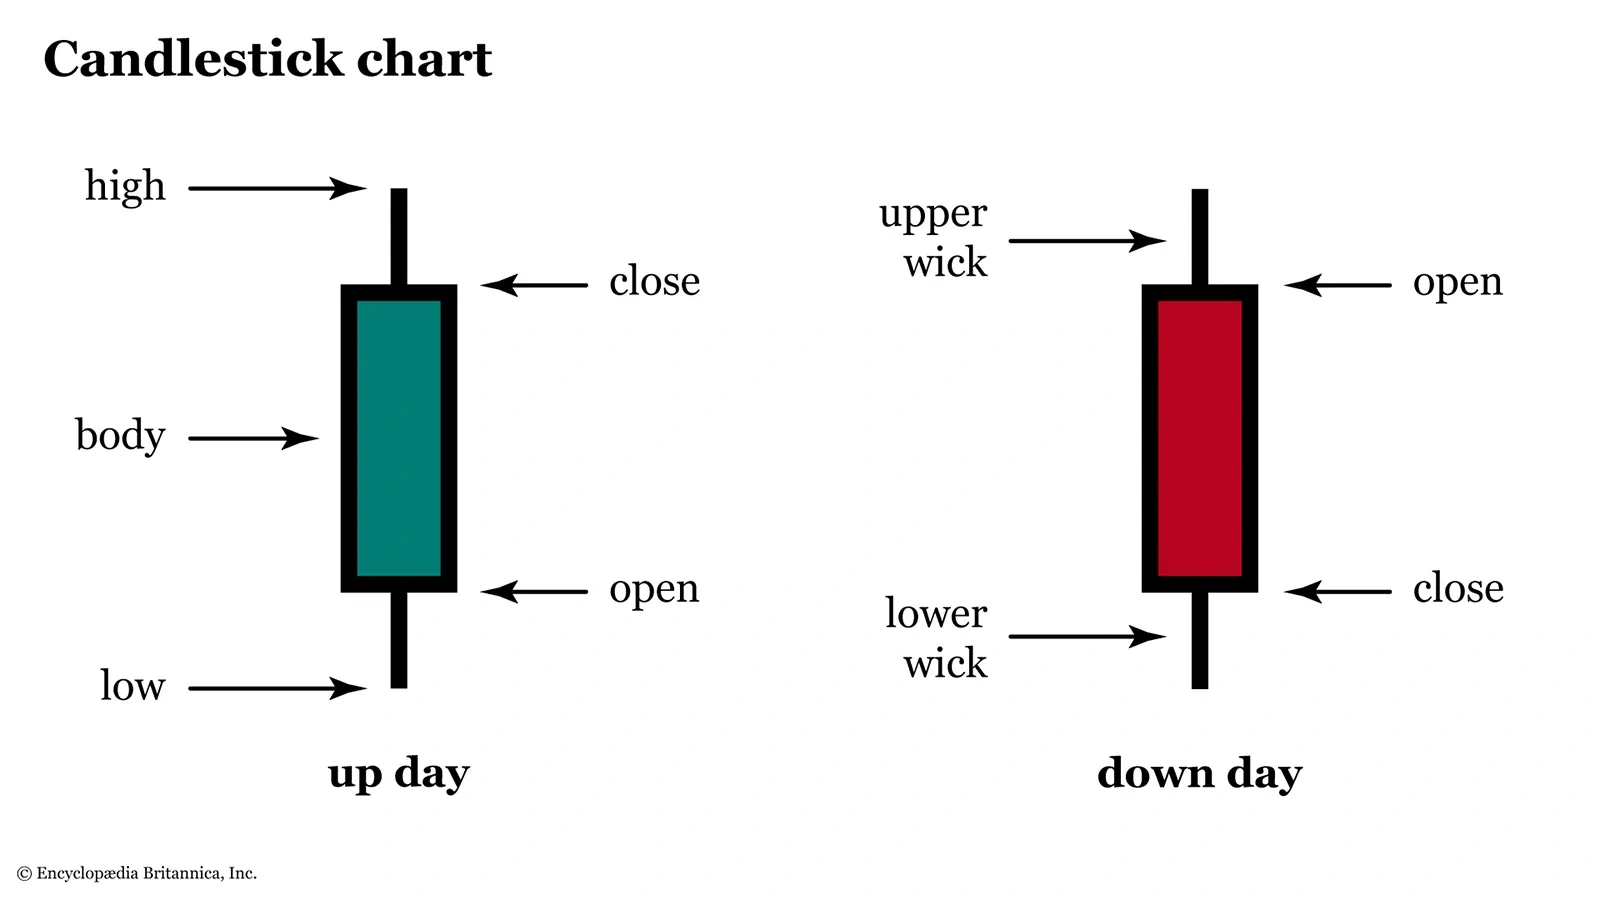
1. Know What a Candlestick Actually Shows
Each candlestick holds four key pieces of price info—open, close, high, and low. This isn’t just trivia—it’s the building block of every chart. Once you know what the candle body and wicks represent, you can begin to see how price moved during a specific period. Green candles mean price closed higher than it opened, red ones mean it closed lower. Simple, but vital.
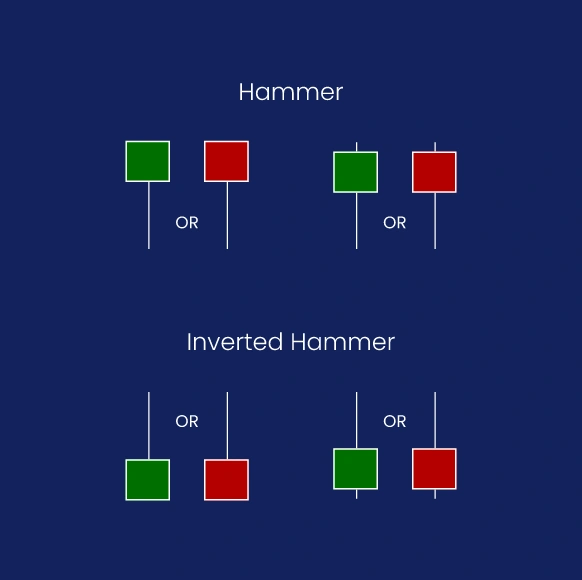
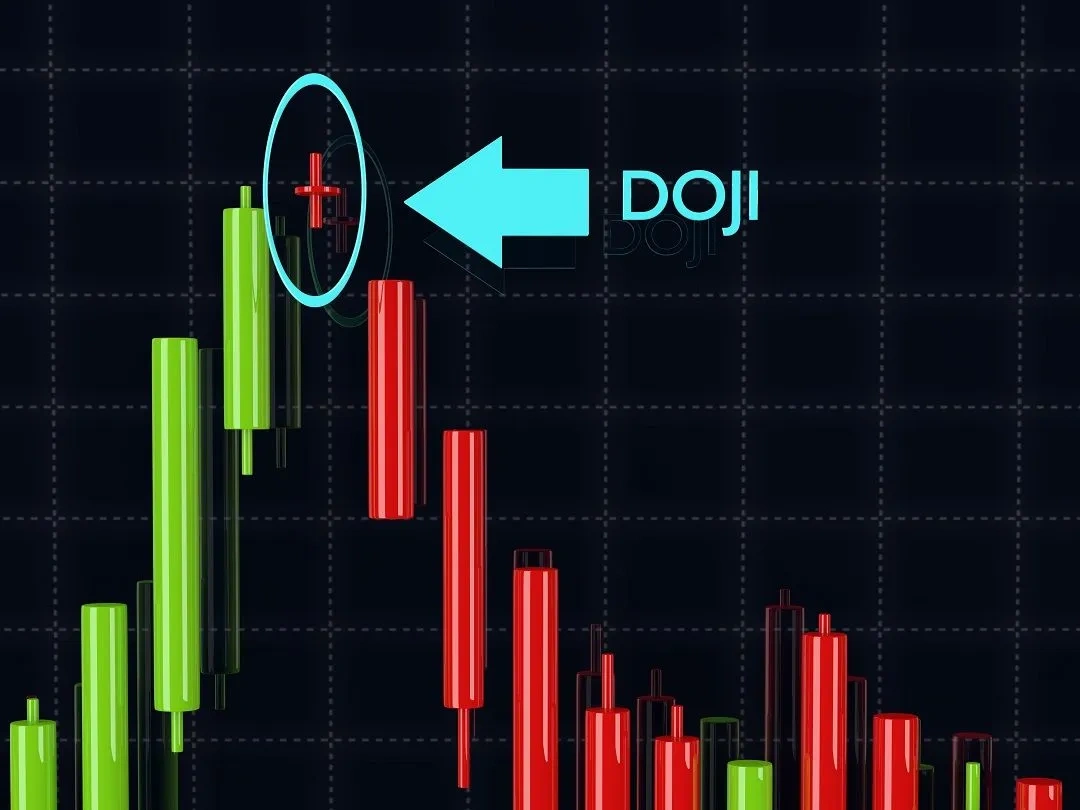
2. Focus on Clusters, Not Single Candles
One candlestick tells a moment; many tell a story. You don’t want to base your whole analysis on a lone “hammer” or “doji.” The magic of candlestick charts is in how multiple candles form patterns. Spotting these clusters—especially during strong trends—can help you figure out whether the market’s hesitating, continuing, or about to reverse.
3. Position Holding and Trend Context Matter
Reading candlestick charts without considering position holding is like trying to read a sentence by staring at one word. Ask: Where is this pattern showing up? At the top of a rally? At support after a crash? Position holding means looking at the “where” and “why,” not just the “what.” A bullish signal at resistance doesn’t mean the same as one at support—it’s all about context.

4. Patterns Help—but Don’t Obsess Over Them
Engulfing candles, morning stars, dark clouds—they’re useful, but not gospel. These patterns have historical significance, yes, but they’re not crystal balls. Some traders treat them like laws, when they’re more like clues. Use them to supplement your broader strategy, not dictate every move. And remember: a pattern is only meaningful in the right context.
5. Candlestick Charts Reveal Emotion, Not Just Data
Behind every candle is a crowd of humans reacting—buying, selling, panicking. Those long wicks? They show rejection. Tiny bodies? Indecision. Candlestick charts are often the clearest window into market sentiment. That’s why traders love them—they give you something price lines alone can’t: emotional insight.
Final Thoughts: Candlestick Charts Aren’t Hard—If You Read Them Right
Learning how to read candlestick patterns is about building intuition, not just memorizing shapes. If you treat them as guides, not answers, you’ll develop a sharper eye for market shifts. Over time, you’ll notice you’re not just reading charts—you’re understanding behavior, spotting tension, and sometimes, predicting the next move.
So don’t be intimidated. Start with the basics, spot what stands out, and always ask where you are in the trend. No system is perfect, but this one? It’s stood the test of time.
Relevant news: here